Tenn-Tom Waterway - Jim Faughn
The purpose of this webpage is to explain what I've learned about traveling the Tenn-Tom when the water is above the normal pool levels. This education really took place in March of 2009 when I was trying to make it up the waterway with a large amount of rainfall causing flood conditions. I will explain parts of the charts along with provide links to a website which provides you graphical water levels along the waterway along with predictions of the future levels based on current weather forecasts. As you will see, these forecasts may not be correct so you will have to exercise a great deal of judgment as captain of your vessel to ensure you and your crew aren't trapped along the waterway in rising water.
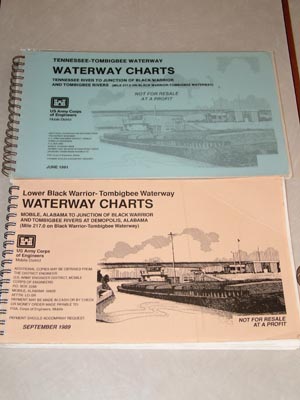
If you are going to travel what is known as the Tennessee-Tombigbee Waterway or what is commonly known as the Tenn-Tom, you will need the charts shown on the right hand side. Actually the Tenn-Tom is the upper portion of the waterway and the lower portion is known as the Lower Black Warrior-Tommbigbee however, it is all commonly referred to as the Tenn-Tom. In addition, if you are going up to Kentucky Lake, you will also need the charts for the Tennessee River. The Lower Black Warrior-Tombigbee chart was published in September 1989 and is still current as of this writing. I understand a new chart is coming out but don't know when. The Tennessee-Tombigee chart was published in June 1991 and it also is scheduled for update. Regardless of the age of the charts, the reality is you will normally want to keep the bow between the red and the green unless it just doesn't make sense. With high water and tows running over the marker buoys, they may be out of place. When going upstream we've seen the reds on the left hand bank which of course is even left of where the green should be. Obviously you aren't going to run ashore to keep the red on your right going upstream. Simply use common sense and don't trust all the buoys. The water will normally be deeper in the bends if the buoys are missing. Also, when the trees are coming down the waterway because of higher water, even a twig can indicate a submerged log. |
 |
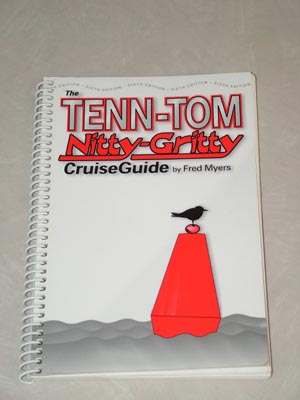 |
The guide to the left is wonderful as you are traveling the Tenn-Tom. Fred is conservative with his anchorages. Don't decide the only place you can anchor is where Fred says. The reality is there are many good anchorages that are easily accessable as you are going upstream especially in the lower Tenn-Tom. For example, in the lower Tenn-Tom, it is fairly straight forward to pull over to the side outside of the main channel and toss out your anchor. If you have checked your water depth and ensured there will be at least 4 feet more water than you think you need on a falling river, you will be fine. Just stay outside of the channel and in a straight away so the Tow's/barges can see you once they get around a turn and get lined up for that stretch of water. Obviously you will want you anchor light on but don't worry, at night they will be spotlighting you anyway. Think about how you would feel if you were driving a boat that was 550 feet long and were constrained by your draft moving about 4.5-5 knots and you encounter a boat anchored in a bend. You wouldn't be too happy so just anchor where you won't be a hazard or even a nuisance to navigation. With all of that said, as you get into the upper Tenn-Tom, anchoring isn't as easy. You have the locks which you may be waiting on for an hour or more because of commercial traffic and you also have fewer sites to anchor. By noon, you will want to figure out your anchoring options and take the one that makes sense. Some days you may make a 50+ mile day and others you just won't. Take what you get based on the locks and current. |
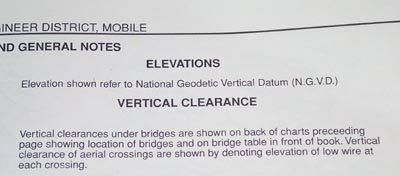
My education really began with the charts. Using the Lower Black Warrior-Tombigbee chart, you can look on sheet A and se the elevations are shown reference to the NGVD. This is important as you look further towards sheet E to interpret the meaning. Also, the vertical clearance for power lines, phone lines, and bridges are expressed differently with regards to the Lower Black Warrior-Tombigbee and the Tennessee-Tombigbee charts. We will take the Lower Black Warrior-Tombigbee first. |
 |
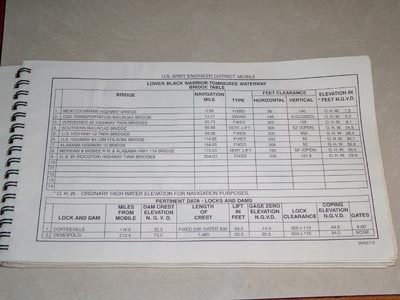 |
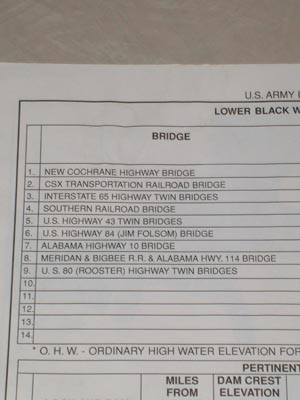
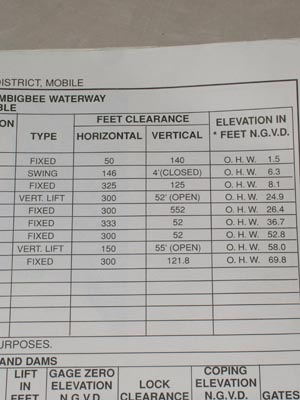
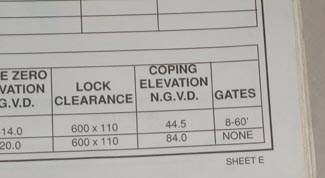
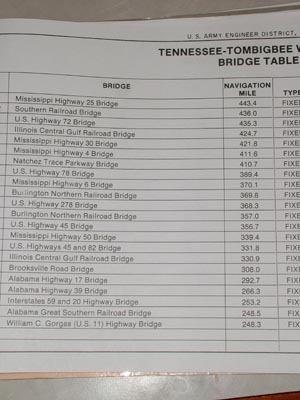
If you turn to sheet E in the Lower Black Warrior-Tombigbee chart set, you will see the Bridge Table. Since the lowest telephone line is 53 feet and it is at mile 114.9 then if you can lear the Jim Folsom Bridge at 114.65, you will clear the cable. Here is the issue reading these charts at least for me. When you are examining the elevation column, it has in it's heading * Feet N.G.V.D. The * means O.H.W. - Ordinary High Water Elevation for Navigation purposes. So, if you read the number of feet in that column for the bridge for the Southern Railroad bridge, 4th one down, you will see it is 52 feet when raised at an ordinary high water of 24.9 feet. Now the question is where do you find out about what the water level is when traveling the Tenn-Tom? There are really three options. One is to call the lockmaster and ask him, the second is to call the Corp of engineers, and the third is to use the internet and lookup a website that I will give you later to check the historical, current, and predicted levels. Corp of Engineers numbers are: Waterway between Tennessee
River and Demopolis - 662-327-242 |
 |
 |
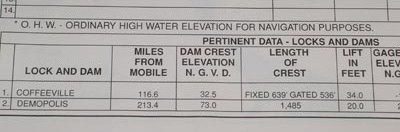
At the bottom of Sheet E you can see the the normal elevations at the headwater of each of the dams. (Headwater refers to the upside of the dam and Tailwater is the down side.) Coffeeville is 32.5 feet and Demopolis is 73 feet. These are important numbers as you examine the charts and compare this information with the water levels. However, it is also important to know what the tailwater level is and the only place I've found that information is on the website you will get in a minute. Fred in the Tenn-Tom waterway guide will give you the gauge readings at the headwater (upper) and tailwater (lower) which you can then determine if there is higher than normal water. |
|
 |
 |
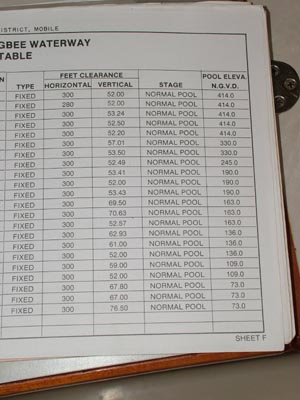
| In the Tennessee-Tombigbee waterway charts, the upper portion, they change the way they list the information. Instead of listing the heights of the bridges above ordinary high water, they list it as above normal pool. To me it is obvious they have more flooding in the lower portion or they just didn't list things with uniformity. I point this out because it will be critical for you to consider the heights if you are on a sailboat with the mast still up the way we typically move on the Tenn-Tom. | |
 |
 |
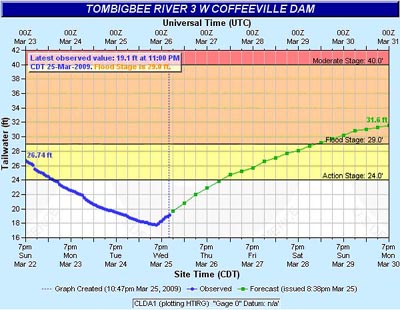
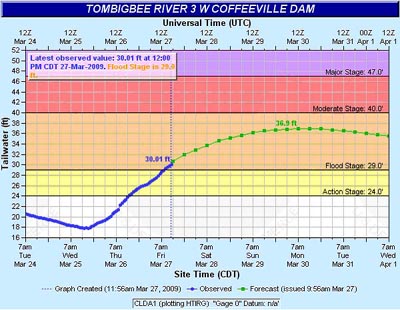
Now it is time for the fun stuff. The following charts are screen shots of data we were using in an aborted attempt to move up the Tenn-Tom. Let's analyze the chart to the lower left first. Along the top is the date and time is listed in UTC. The vertical is listed as Tailwater height in feet and would be the N.G.V.D. Along the bottom is the Date and you can see the chart shows a blue line which is the actual data and a green line with dots which is the forecast based on their prediction. This is where things get interesting. Coffeeville Dam is located at mile 116.6. The closest bridge to this is at 114.65 so I have shown below the tailwater chart (below the lock) because I was interested to know if I would fit under the bridge at 114.65. That bridge is listed as a height of 52 feet at ordinary high water. Ordinary high water is the first level of Flood Stage or put another way the highest level of their action stage. So, lets just say you have a mast height of 51.5 feet. You are stuck when it gets to the flood stage of 29 feet unless you just like playing risky business. However, with our mast height of 46 feet plus our light would bring me to 46.8 feet or just call it 47 feet. I actually could travel at 34 feet of water in the tailwater of Coffeeville and clear the bridge. However, the current would probably be so strong that I would only hover. On our particular trip I started out thinking this data on March 26 would hold. However, it seemed like we parked under a waterfall that night and it dumped 4+ inches of rain and the forecast changed for the future and the front was to back up and rain again the next evening. We bailed out and returned to Fairhope to wait out the flood. As it turned out, this was the right decision because as soon as we were at the dock, I got the screen shot to the lower right and found out the water rose to the level of 30 feet which wasn't predicted to happen for 3 more days when we would have been clear of Coffeeville. Bottom line is we made the right choice and we also were able to provide all of this data for you to look at. In the end, the water came up even higher on the next day than they predicted because of 6 more inches of rain. By the way, as I'm writing this on Sunday March 29th, the actual water level is at 36.9 feet which as you can see matches their projection for tomorrow but it is a day early. |
|
March
26, 2009 6:00 am data
|
March 27, 2009 3:00 p.m. data - Same website
|
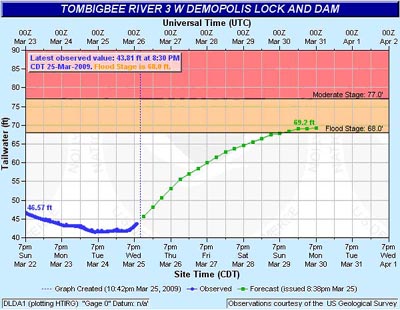
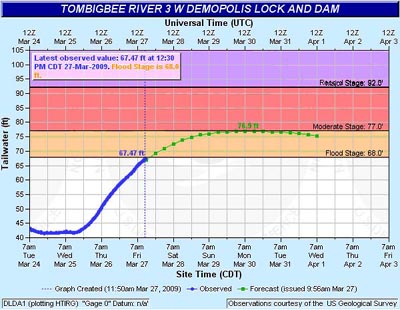
| We've explained the charts so all you have to do is look at the difference at Demopolis. Water actually rose 25 feet in a day and a half. And on March 29th it is at 76.9 feet which is also a day early. | |
March
26, 2009 6:00 am data
|
March 27, 2009 3:00 p.m. data - Same website
|
| Of course you can mark the website's above but the easiest thing is to know where to get the rest of the gauges and charts. | |
For
the Coffeeville Dam to Mobile the address is - You can choose the point you want to look at and see the charts. All you have to do is click on the link above and then click on the name you are interested in. |
 |
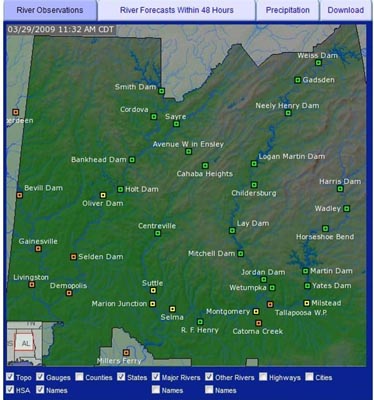
From Demopolis to Aberdeen http://ahps.srh.noaa.gov/index.php?wfo=bmx |
 |
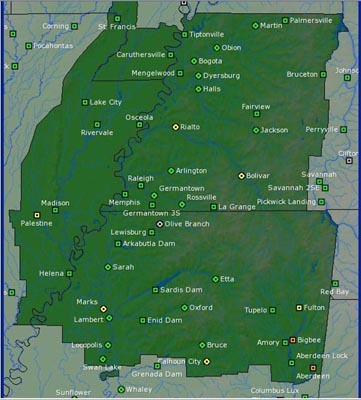
And from Aberdeen to Fulton http://ahps.srh.noaa.gov/index.php?wfo=meg |
 |
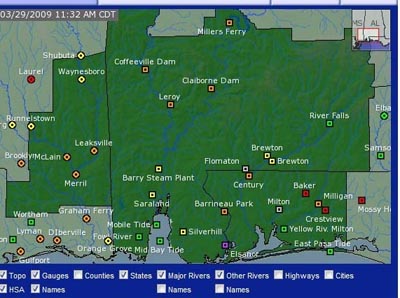
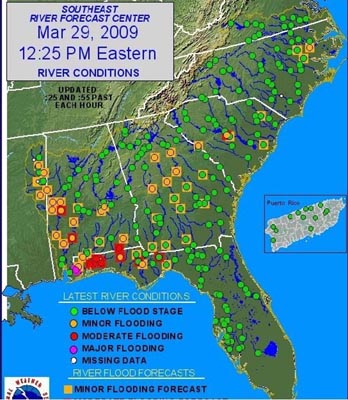
Of course the real one you want to bookmark is: http://www.srh.noaa.gov/alr/ahps/default.htm This gives you a good big picture view of flooding and when you click on one of the dots, it takes you to a page you saw above. Then you click on the name of the gauge you want to view. |
 |
This is my shot at explaining what I've learned about Tenn-Tom travel in flooding conditions. Of course what I've really learned is don't start up the river when the water is forecast to rise dramatically. Instead, wait until the water level is going to be heading below the action stage and there is no rain for 3-4 days in the forecast. This way you will be facing fewer trees floating in the water along with a decreasing current. Good luck and if you find something that really could use a better explanation, please let me know. - Jim Faughn |
|
Web Page by Jim Faughn